Dashboard Overview
Dashboard
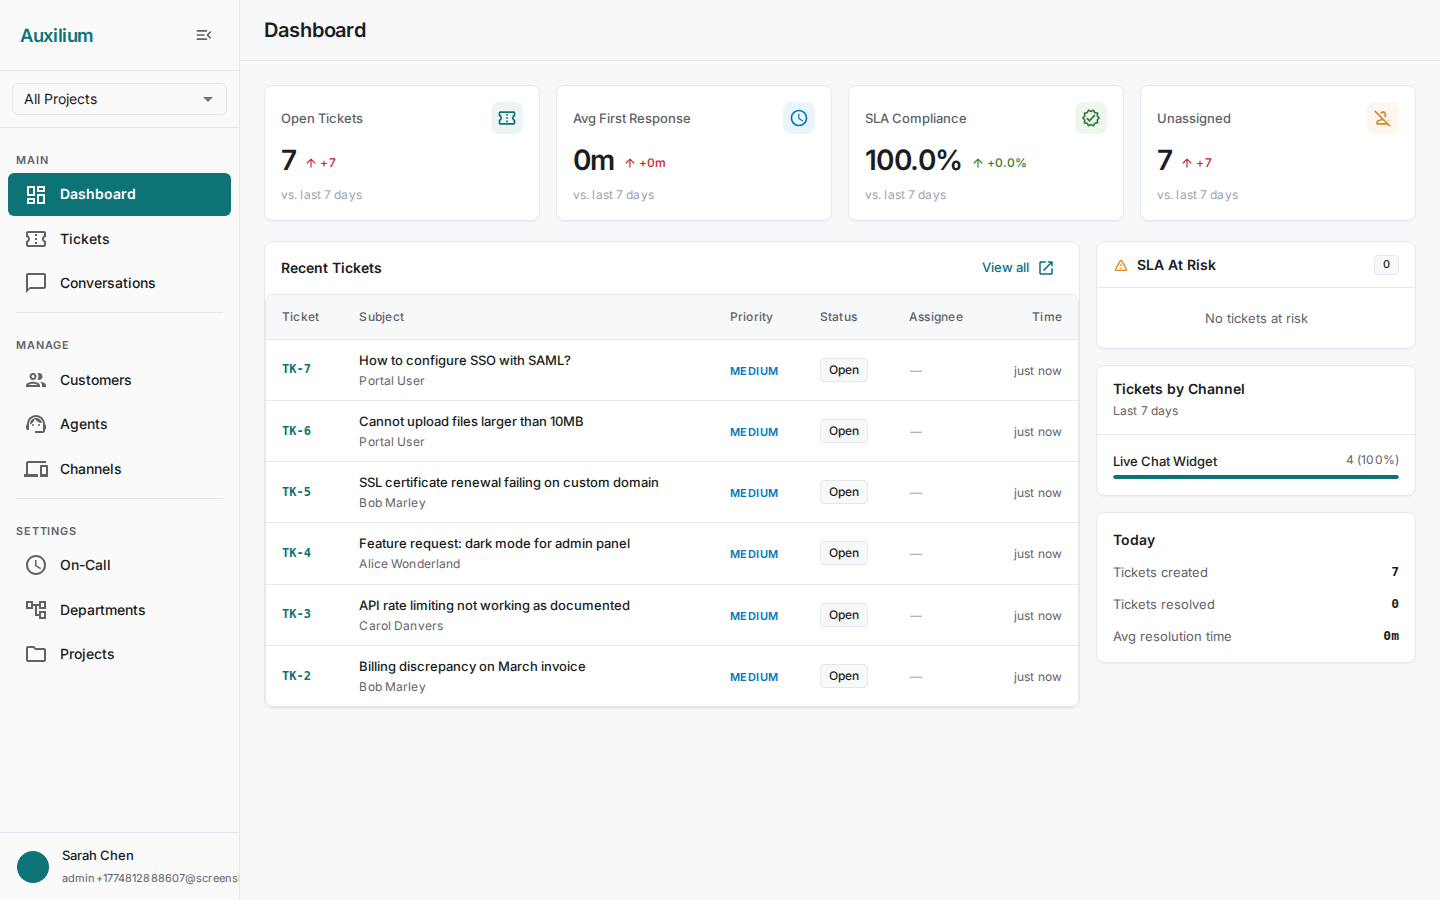
The dashboard is your command center for support operations. It gives you a single-screen view of key performance indicators, recent ticket activity, SLA health, and channel distribution so you can spot issues before they escalate.
Page layout
The dashboard is divided into three areas:
- KPI stat cards – four metrics across the top of the page.
- Recent Tickets table – the main content area showing the latest incoming work.
- Right sidebar – three insight cards stacked vertically.
KPI stat cards
Four cards span the top of the dashboard. Each card shows a current value and a trend arrow comparing it to the previous period.
| Card | What it measures | Reading the trend |
|---|---|---|
| Open Tickets | Count of tickets currently in open or in-progress status. | An upward arrow means your backlog is growing compared to the previous period. |
| Avg First Response | Average time from ticket creation to the first agent reply, displayed as a formatted duration (e.g. “4m 12s”). | A downward arrow is good – your team is responding faster. |
| SLA Compliance | Percentage of tickets meeting their SLA targets. | An upward arrow means compliance is improving. |
| Unassigned Tickets | Count of tickets with no active agent assignment. | A downward arrow means fewer tickets are sitting in the queue unowned. |
Recent Tickets table
The center of the dashboard displays a table of the most recently created tickets. This gives you a quick at-a-glance view of incoming work.
| Column | Description |
|---|---|
| Ticket # | The per-tenant ticket number. |
| Subject | The ticket subject line, shown alongside the customer’s name. |
| Priority | Priority level (Urgent, High, Medium, Low). |
| Status | Current ticket status (e.g. Open, In Progress, Resolved). |
| Assignee | Name of the assigned agent, or empty if unassigned. |
| Time | How long ago the ticket was created. |
Click the View all button below the table to navigate to the full tickets list.
Right sidebar
The sidebar contains three cards that provide deeper operational insight.
SLA At Risk
This card lists tickets that are approaching their SLA resolution deadline. Each entry shows:
- The ticket subject.
- The remaining time before the SLA breaches.
- A severity indicator:
| Severity | Meaning |
|---|---|
| Critical (red) | Less than 30 minutes remaining. Requires immediate attention – assign or escalate now. |
| Warning (yellow) | Less than 2 hours remaining. Prioritize this ticket in the current work queue. |
If no tickets are at risk, the card displays an empty state.
Tickets by Channel
This card shows the distribution of tickets across your support channels as horizontal bar charts. Each bar displays:
- The channel name (e.g. Email, Web Widget, Slack).
- The ticket count for that channel.
- The percentage of total volume that channel represents.
Use this to understand where your customers are reaching you and whether channel-specific staffing adjustments are needed.
Today Stats
A quick snapshot of the current day’s activity:
| Metric | Description |
|---|---|
| Tickets created | Number of new tickets opened today. |
| Tickets resolved | Number of tickets resolved or closed today. |
| Avg resolution time | Average time to resolve tickets closed today, displayed as a formatted duration. |
This card helps you gauge whether the team is keeping pace with incoming volume on any given day.